

June Highlights
- Median listed rent was $1,876 in the 50 largest US metropolitan areas.
- Rent grew by 14.1% over June of 2021, the lowest growth rate so far this year.
- Rent growth is concentrated in metros with low unemployment rates.
- In 38 of the 50 largest US metros, the monthly cost of renting a home is lower than buying a starter home, and renting has become relatively more affordable year-over-year.
Rent Reaches Another Record Nationwide, but Growth Continues to Slow
The median rent across the 50 largest US metropolitan areas reached $1,876 in June, a new record level for Realtor.com data for the 16th consecutive month. Year-over-year rent growth, though, continued to fall in an indication that the rent eruption of the past two years may be beginning to subside. The 14.1% growth rate is the latest installment in the 5-month skid from a 17.3% peak in January. Despite the slowdown, rent remains 23.9% higher than it was in June 2020 and 27.6% higher than in June 2019.
Figure 1: Year-over-Year Rent Trend

Miami again takes the top spot in terms of year-over-year rent growth, but at 37.4%, its lead over its Florida neighbor in second place, Orlando (23.9%), has shrunk from recent months. Also among the markets with the highest rent growth are other Sun Belt cities like Austin (19.6%), San Diego (19.1%), San Jose (18.5%), Nashville (18.4%), and Charlotte (18.4%); with the Northeastern markets of Providence (23.8%), Boston (23.6%), and New York (21.1%) rounding out the top 10. Rent grew the slowest in Minneapolis at just 3.3% year-over year, followed by New Orleans (6.6%), Philadelphia (6.8%), Riverside (7.2%), Sacramento (7.3%), St. Louis (7.5%), Rochester (8.4%), Cincinnati (9.1%), Pittsburgh (9.4%), and Detroit (9.6%).
Local unemployment rates continued to be strong predictors of rent growth, with the top 10 rent growth markets averaging 2.87% in May 2022 and the bottom 10 averaging 3.42% compared to the average rate across the top 50 metros of 3.25%. Notable exceptions include New York, where rent growth was high despite an above-average unemployment rate of 4.2%, and Minneapolis, which has the lowest unemployment rate of the 50 metros and also the lowest rent growth. The cities with stronger economies attract more workers to compete for leases and pay higher rents, while renters in cities with higher unemployment face less competition and are less able to pay fast-growing rent charges.
Studio Rents Are Still Growing Fastest, but Beginning to Converge with Larger Units
Throughout 2022, studio unit rent has been growing faster than rent for 1- and 2-bedroom units after trailing through the peak of the pandemic. In June, though, this gap shrank and studio rent growth appears to be converging with that of larger rentals after peaking a few months later than them. On a two-year horizon, studio rents have grown more slowly than larger unit rents.
Table 1: National Rents by Unit Size
| Unit Size | Median Rent | Rent YoY | Rent Change – 2 years |
| Overall | $1,876 | 14.1% | 23.9% |
| Studio | $1,544 | 15.1% | 19.3% |
| 1-bed | $1,738 | 13.8% | 22.9% |
| 2-bed | $2,104 | 13.6% | 25.6% |
Figure 2: National Rent by Unit Size Trend

Renting Is More Affordable Than Buying a Starter Home in Most Metros
In 38 of the 50 largest US metros, the monthly cost of renting a home is lower than buying a starter home. This is a stark difference from earlier this year. When we conducted this same analysis in January, just 24 markets favored renting. Relatively stable rent growth contributed to this shift: year-over-year rent growth peaked in January at 17.3% and has decreased each consecutive month, and rent in June is just 6.3% higher than in January. The biggest driver, though, is that the cost of financing a home purchase has skyrocketed in the first half of the year. The average 30-year fixed mortgage rate as reported by Freddie Mac was 3.45% in January compared to 5.52% in June.
To determine the monthly cost of buying a home instead of renting, we focus on listings of 0- to 2-bedroom homes to find the median listing price for “starter” homes. We assume a 7% down payment (based on the national average since 2018) and use the average of the Freddie Mac 30-year fixed mortgage rate during the month to determine a monthly mortgage payment, and then we add in the costs of HOA fees, taxes, and homeowner’s insurance averaged at a metro level. We then compare this to the median rent in each metro and focus on the buy-minus-rent gap.
Just like we found that low unemployment is correlated with strong rent growth, a macroeconomic variable of recent infamy, inflation, is correlated with smaller gaps in the monthly cost of buying vs renting. Among the 5 metros where year-over-year growth in the consumer price index for all items was lowest, buying a starter home was $1804/month (62.8% of monthly rent) more expensive than renting. Meanwhile, the 5 metros with the highest growth in the cost of living have an average gap between buying and renting of just $373, or 16.6% of monthly rent. The low-inflation metros are San Francisco, New York City, Boston, Washington DC, and Los Angeles. In these areas, the cost of living was already high and the choices for housing were already sparse, so in-migration has not added fuel to the inflation fire. In the high-inflation metros (Tampa, Phoenix, Atlanta, Miami, Riverside) though, the smaller gap between the cost of buying a home and renting one has attracted homebuyers from costlier metros, and the new arrivals chasing after the same consumer goods has driven the cost of living higher.
Below are two tables displaying the metros where buying is the most affordable relative to renting and where renting is the most affordable relative to buying. The buy-favoring cities are all in the Midwest and South. Interestingly, none have median rents that are higher than the national average, but all have monthly buy costs for starter homes well below the national average. The rent-favoring cities are larger, more geographically distributed, and tend to be markets with higher concentrations of tech workers and high earners. Austin, where the monthly buy cost is nearly double the monthly rent cost, leads the way in rent favorability.
Table 2: Top 10 Metros that Favor Buying over Renting
| Metro | Median Rent | Monthly Buy Cost | $ Difference (Buy-Rent) | % Difference (Buy-Rent) | Rent YY | Buy Cost YY |
| Pittsburgh, PA | $1,583 | $1,061 | -$522 | -33.0% | 9.4% | 3.8% |
| Birmingham-Hoover, AL | $1,278 | $900 | -$377 | -29.5% | 9.8% | 17.2% |
| St. Louis, MO-IL | $1,371 | $1,087 | -$284 | -20.7% | 7.5% | 23.6% |
| Cleveland-Elyria, OH | $1,432 | $1,234 | -$198 | -13.8% | 12.1% | 28.4% |
| Baltimore-Columbia-Towson, MD | $1,820 | $1,656 | -$164 | -9.0% | 9.6% | 21.2% |
| Louisville/Jefferson County, KY-IN | $1,253 | $1,189 | -$63 | -5.0% | 13.9% | 25.7% |
| Virginia Beach-Norfolk-Newport News, VA-NC | $1,581 | $1,526 | -$55 | -3.5% | 11.7% | 43.4% |
| Indianapolis-Carmel-Anderson, IN | $1,303 | $1,266 | -$36 | -2.8% | 10.9% | 31.4% |
| Cincinnati, OH-KY-IN | $1,499 | $1,485 | -$14 | -0.9% | 9.1% | 7.2% |
| Kansas City, MO-KS | $1,326 | $1,313 | -$12 | -0.9% | 10.2% | 24.4% |
Table 3: Top 10 Metros that Favor Renting over Buying
| Metro | Median Rent | Monthly Buy Cost | $ Difference (Buy-Rent) | % Difference (Buy-Rent) | Rent YY | Buy Cost YY |
| Austin-Round Rock, TX | $1,864 | $3,685 | $1,822 | 97.8% | 19.6% | 37.7% |
| San Francisco-Oakland-Hayward, CA | $3,171 | $5,705 | $2,535 | 79.9% | 12.6% | 33.7% |
| Seattle-Tacoma-Bellevue, WA | $2,299 | $4,100 | $1,801 | 78.3% | 15.7% | 36.2% |
| New York-Newark-Jersey City, NY-NJ-PA | $2,989 | $5,081 | $2,092 | 70.0% | 21.1% | 43.2% |
| San Jose-Sunnyvale-Santa Clara, CA | $3,324 | $5,499 | $2,175 | 65.4% | 18.5% | 31.0% |
| Portland-Vancouver-Hillsboro, OR-WA | $1,833 | $2,961 | $1,128 | 61.6% | 10.5% | 31.9% |
| Los Angeles-Long Beach-Anaheim, CA | $3,051 | $4,897 | $1,846 | 60.5% | 14.1% | 28.7% |
| Boston-Cambridge-Newton, MA-NH | $2,966 | $4,664 | $1,698 | 57.3% | 23.6% | 26.4% |
| Houston-The Woodlands-Sugar Land, TX | $1,450 | $2,223 | $773 | 53.3% | 10.2% | 33.1% |
| Phoenix-Mesa-Scottsdale, AZ | $1,781 | $2,709 | $929 | 52.2% | 11.1% | 58.1% |
Buy vs Rent Gap Breakdown Since Last Year
The trend toward rent favorability is sharply pronounced when we compare the rent vs buy decision this month to June of last year. The average cost to buy a starter home across the 50 largest US metros was $2,437 per month this June, $561 (29.9%) higher than the average listed rent. In 2021, however, the monthly cost to buy was $1,815, just $171 (10.4%) higher than rent. The image below shows the contributing factors and the role they played in tripling the gap between average rent cost and average buy cost nationwide.
Figure 3: Components of Buy-Rent Gap Change from Last Year
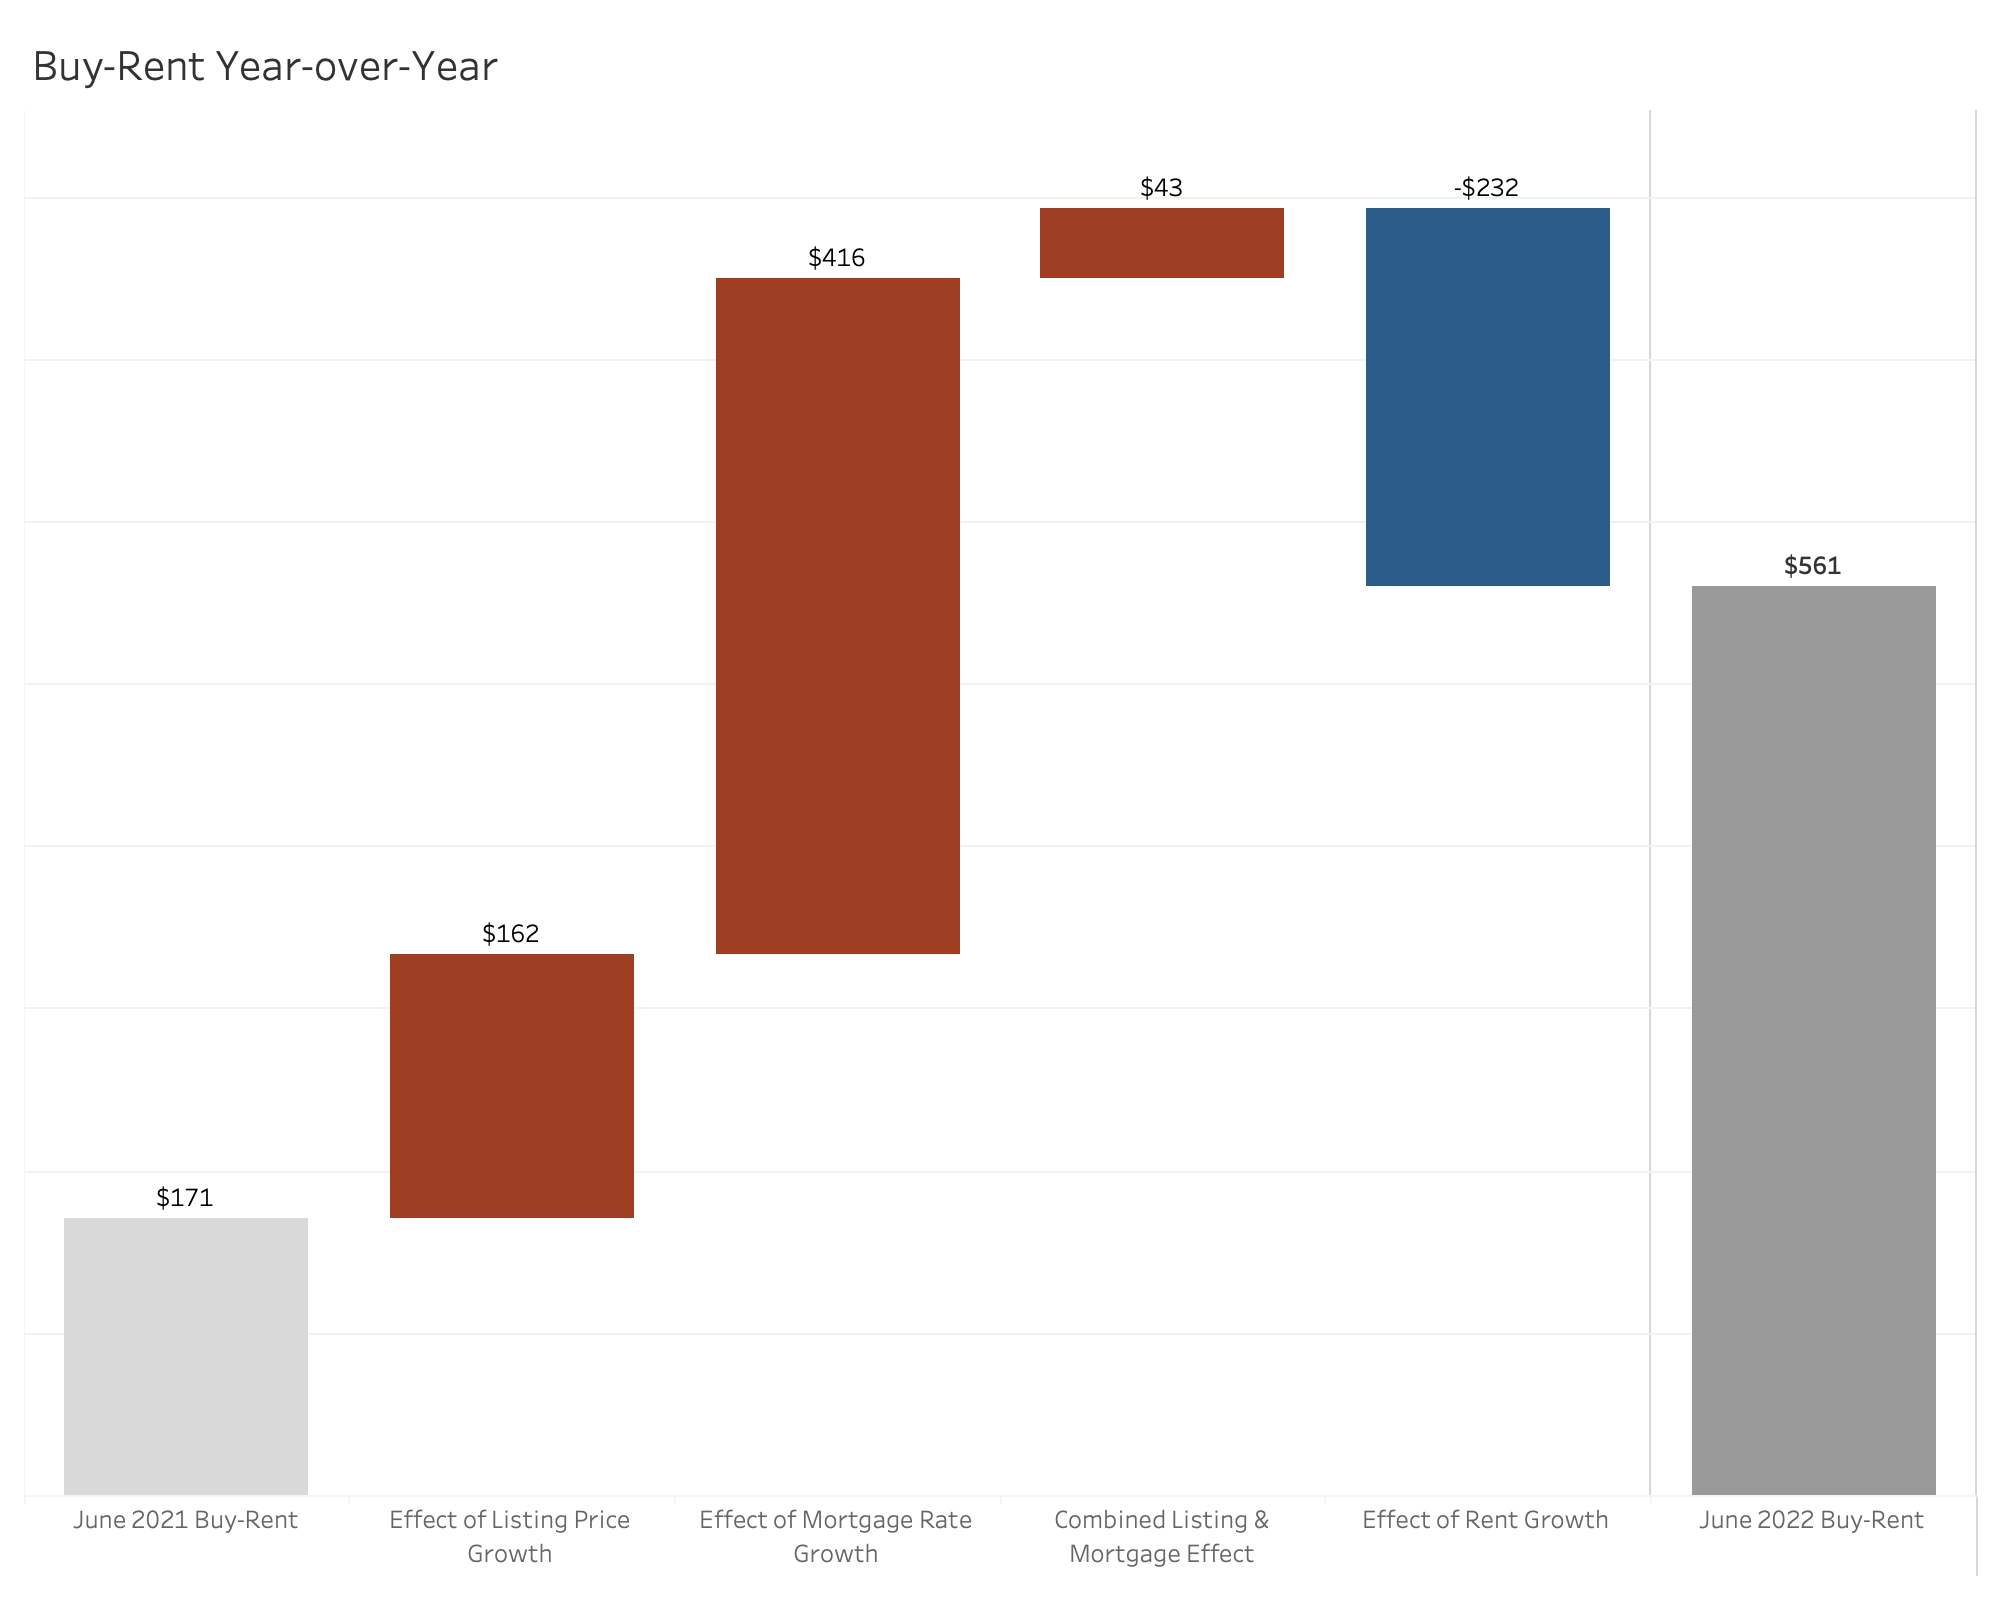
Listing price growth for starter homes across the 50 largest metropolitan areas was actually the least significant component of the year-to-year change. Holding all else constant, the appreciation in asking prices would only have increased the monthly cost of buying a home by $162. Year-over-year rent growth was actually a more significant effect in the opposite direction, decreasing the size of the buy-rent gap by $232 (the difference between June 2022 median rent and June 2021 median rent). The clear driver of renting becoming even more affordable relative to buying from June of 2021 to June of 2022 is the cost of financing a home purchase. The cost of buying a starter home at current listing prices is $416 higher under current mortgage rates than it would have been under last year’s mortgage rates. Without this effect, the gap would have shrunk and buying in 2022 would have been more affordable relative to renting than in 2021.
8 of the top 50 metros flipped from having monthly buy costs lower than monthly rent costs in 2021 to having monthly rent costs lower than monthly buy costs in 2022, and 1 metro flipped from favoring renting to favoring buying since last year. The buy-to-rent flippers all had outsized gains in the monthly cost of buying a starter home there, driven by strong listing price growth and exacerbated by mortgage rate increases. In Jacksonville, Philadelphia, Hartford, Atlanta, Riverside, Tampa, Detroit, and Charlotte; renting was more expensive than buying in June 2021 but renting is less expensive than buying in June 2022. The lone fish swimming upstream is Cincinnati, where the cost to buy a starter home increased only 7.2% while rent grew by 9.1%, causing buying a starter home to become less expensive than renting over the course of the year.
Table 4: Rental Data – 50 Largest Metropolitan Areas – June 2022
| Metro | Overall Median Rent | Overall Rent YY | Studio Median Rent | Studio Rent YY | 1-br Median Rent | 1-br Rent YY | 2-br Median Rent | 2-br Rent YY |
| Atlanta-Sandy Springs-Roswell, GA | $1,858 | 10.8% | $1,718 | 14.6% | $1,731 | 11.4% | $2,065 | 9.4% |
| Austin-Round Rock, TX | $1,864 | 19.6% | $1,534 | 22.8% | $1,720 | 23.5% | $2,050 | 17.0% |
| Baltimore-Columbia-Towson, MD | $1,820 | 9.6% | $1,451 | 2.6% | $1,716 | 9.2% | $1,940 | 10.2% |
| Birmingham-Hoover, AL | $1,278 | 9.8% | $982 | -3.8% | $1,186 | 8.5% | $1,343 | 11.5% |
| Boston-Cambridge-Newton, MA-NH | $2,966 | 23.6% | $2,499 | 24.3% | $2,757 | 19.9% | $3,305 | 25.6% |
| Buffalo-Cheektowaga-Niagara Falls, NY | $1,345 | 10.0% | $1,125 | 2.7% | $1,195 | 8.7% | $1,495 | 8.9% |
| Charlotte-Concord-Gastonia, NC-SC | $1,752 | 18.4% | $1,619 | 20.9% | $1,659 | 19.4% | $1,880 | 12.1% |
| Chicago-Naperville-Elgin, IL-IN-WI | $2,000 | 14.3% | $1,700 | 25.9% | $1,960 | 15.3% | $2,200 | 12.5% |
| Cincinnati, OH-KY-IN | $1,499 | 9.1% | $1,200 | 10.6% | $1,438 | 9.3% | $1,626 | 5.8% |
| Cleveland-Elyria, OH | $1,432 | 12.1% | $948 | 6.8% | $1,317 | 8.6% | $1,593 | 16.5% |
| Columbus, OH | $1,310 | 11.2% | $1,089 | 10.6% | $1,235 | 11.5% | $1,412 | 10.8% |
| Dallas-Fort Worth-Arlington, TX | $1,702 | 17.7% | $1,449 | 18.0% | $1,567 | 19.1% | $1,988 | 16.0% |
| Denver-Aurora-Lakewood, CO | $2,032 | 10.2% | $1,666 | 9.1% | $1,900 | 10.8% | $2,394 | 10.7% |
| Detroit-Warren-Dearborn, MI | $1,445 | 9.6% | $1,107 | 11.3% | $1,195 | 6.0% | $1,600 | 9.3% |
| Hartford-West Hartford-East Hartford, CT | $1,755 | 11.3% | $1,469 | 26.9% | $1,606 | 8.2% | $2,063 | 11.8% |
| Houston-The Woodlands-Sugar Land, TX | $1,450 | 10.2% | $1,356 | 6.7% | $1,333 | 10.5% | $1,627 | 8.5% |
| Indianapolis-Carmel-Anderson, IN | $1,303 | 10.9% | $1,059 | 9.2% | $1,207 | 14.0% | $1,445 | 10.5% |
| Jacksonville, FL | $1,647 | 17.8% | $1,192 | 25.5% | $1,537 | 16.7% | $1,809 | 17.3% |
| Kansas City, MO-KS | $1,326 | 10.2% | $1,024 | 3.8% | $1,252 | 14.3% | $1,533 | 11.2% |
| Las Vegas-Henderson-Paradise, NV | $1,650 | 14.7% | $1,295 | 18.3% | $1,514 | 14.0% | $1,760 | 11.8% |
| Los Angeles-Long Beach-Anaheim, CA | $3,051 | 14.1% | $2,329 | 17.2% | $2,798 | 16.2% | $3,505 | 14.1% |
| Louisville/Jefferson County, KY-IN | $1,253 | 13.9% | $1,046 | 15.6% | $1,148 | 10.1% | $1,420 | 12.1% |
| Memphis, TN-MS-AR | $1,408 | 12.2% | $1,149 | 10.0% | $1,368 | 12.4% | $1,552 | 12.5% |
| Miami-Fort Lauderdale-West Palm Beach, FL | $2,850 | 37.4% | $2,499 | 38.8% | $2,494 | 31.7% | $3,245 | 37.5% |
| Milwaukee-Waukesha-West Allis, WI | $1,580 | 10.9% | $1,230 | 7.0% | $1,470 | 8.9% | $1,798 | 9.1% |
| Minneapolis-St. Paul-Bloomington, MN-WI | $1,597 | 3.3% | $1,250 | 3.7% | $1,502 | 2.8% | $1,943 | 2.1% |
| Nashville-Davidson–Murfreesboro–Franklin, TN | $1,780 | 18.4% | $1,665 | 6.0% | $1,650 | 17.1% | $1,909 | 21.1% |
| New Orleans-Metairie, LA | $1,765 | 6.6% | $1,400 | 25.7% | $1,640 | 9.3% | $2,063 | 8.6% |
| New York-Newark-Jersey City, NY-NJ-PA | $2,989 | 21.1% | $2,700 | 34.8% | $2,693 | 18.1% | $3,365 | 18.1% |
| Oklahoma City, OK | $1,033 | 14.1% | $958 | 35.1% | $933 | 9.9% | $1,140 | 15.7% |
| Orlando-Kissimmee-Sanford, FL | $1,979 | 23.9% | $1,721 | 22.4% | $1,833 | 23.4% | $2,246 | 25.9% |
| Philadelphia-Camden-Wilmington, PA-NJ-DE-MD | $1,811 | 6.8% | $1,535 | 7.9% | $1,748 | 5.9% | $1,995 | 5.0% |
| Phoenix-Mesa-Scottsdale, AZ | $1,781 | 11.1% | $1,441 | 12.9% | $1,629 | 10.9% | $1,950 | 8.6% |
| Pittsburgh, PA | $1,583 | 9.4% | $1,294 | 7.8% | $1,570 | 9.4% | $1,742 | 8.0% |
| Portland-Vancouver-Hillsboro, OR-WA | $1,833 | 10.5% | $1,456 | 3.1% | $1,789 | 10.3% | $2,197 | 9.4% |
| Providence-Warwick, RI-MA | $2,200 | 23.8% | $1,759 | 11.0% | $1,908 | 22.5% | $2,500 | 26.7% |
| Raleigh, NC | $1,675 | 16.7% | $1,531 | 20.4% | $1,562 | 19.1% | $1,894 | 16.8% |
| Richmond, VA | $1,465 | 13.4% | $1,188 | 16.1% | $1,334 | 13.8% | $1,586 | 14.1% |
| Riverside-San Bernardino-Ontario, CA | $2,622 | 7.2% | $1,840 | 24.3% | $2,203 | 6.4% | $2,850 | 6.7% |
| Rochester, NY | $1,362 | 8.4% | $1,000 | 12.0% | $1,318 | 14.6% | $1,498 | 11.2% |
| Sacramento–Roseville–Arden-Arcade, CA | $2,102 | 7.3% | $1,861 | 3.7% | $1,993 | 5.6% | $2,285 | 7.1% |
| San Antonio-New Braunfels, TX | $1,413 | 16.7% | $1,273 | 14.8% | $1,296 | 18.3% | $1,621 | 16.5% |
| San Diego-Carlsbad, CA | $3,182 | 19.1% | $2,485 | 17.9% | $2,943 | 23.2% | $3,558 | 19.4% |
| San Francisco-Oakland-Hayward, CA | $3,171 | 12.6% | $2,541 | 15.0% | $2,914 | 11.7% | $3,626 | 9.7% |
| San Jose-Sunnyvale-Santa Clara, CA | $3,324 | 18.5% | $2,529 | 12.7% | $3,104 | 18.9% | $3,735 | 18.5% |
| Seattle-Tacoma-Bellevue, WA | $2,299 | 15.7% | $1,892 | 18.1% | $2,270 | 13.3% | $2,731 | 14.6% |
| St. Louis, MO-IL | $1,371 | 7.5% | $998 | 7.0% | $1,292 | 7.7% | $1,500 | 7.0% |
| Tampa-St. Petersburg-Clearwater, FL | $2,109 | 16.5% | $2,020 | 20.2% | $1,899 | 16.4% | $2,318 | 17.0% |
| Virginia Beach-Norfolk-Newport News, VA-NC | $1,581 | 11.7% | $1,372 | 12.5% | $1,493 | 11.1% | $1,721 | 9.2% |
| Washington-Arlington-Alexandria,DC-VA-MD-WV | $2,198 | 11.5% | $1,757 | 9.9% | $2,082 | 11.6% | $2,610 | 10.1% |
Methodology
Rental data as of June for units advertised as for-rent on Realtor.com®. Rental units include apartment communities as well as private rentals (condos, townhomes, single-family homes). All units were studio, 1-bedroom, or 2-bedroom units. We use communities that reliably report data each month within the top 50 largest metropolitan areas. National rents were calculated by averaging the medians of the 50 largest metropolitan areas.Realtor.com® began publishing regular monthly rental trends reports in October 2020 with data history stretching back to March 2019.
Memphis buy cost data was excluded due to irregularities. Tax and insurance data were collected from Moody’s and bankrate.com respectively. Median listed prices for starter homes are a weighted average of the median listed prices for 0-, 1-, and 2-bedroom listings based on listing count.
Note: With the release of its May 2022 rent report, Realtor.com® incorporated a new and improved methodology for capturing and reporting rental listing trends and metrics. The new methodology is expected to yield a cleaner and more consistent measurement of rental listings and trends at both the national and local level. The methodology has been adjusted to better represent the true cost of primary housing for renters. Most areas across the country will see minor changes with a smaller handful of areas seeing larger updates. As a result of these changes, the rental data released since May 2022 will not be directly comparable with previous releases (files downloaded before May 2022) and Realtor.com® economics blog posts. However, future data releases, including historical data, will consistently apply the new methodology.
Subscribe to our mailing list to receive monthly updates and notifications on the latest data and research.